


by Doug Larsen
About this time each year, I take a pleasant summer day and clutter it up with duck statistics. The annual Waterfowl Breeding Population and Habitat Survey has arrived, and we all begin searching columns of numbers for a clue. As if somewhere between mallards and May ponds there is a secret message telling us exactly how many ducks will attempt to land in our decoys. If the government could predict where ducks would be, they would already be charging us for the coordinates.
Annually, the survey is the best broad look we have at the health of North America’s breeding ducks and their habitat. The U.S. Fish and Wildlife Service, Canadian Wildlife Service, and flyway councils cooperate on the scientific work. Biologists fly established routes, conduct ground observations, and use the gathered data to estimate populations across a vast breeding landscape. It is less like taking attendance and more like estimating the crowd at a football game, except the crowd has wings and keeps moving across Saskatchewan.
This year’s report contains both good news and bad news, sometimes in the same line. The 2026 estimate is 33.439 million ducks, down 2% from last year’s 33.980 million and 6% below the long-term average. That is not a collapse, but it is not a number that will spur wader sales either. The most encouraging figure appears at the bottom of the report: May ponds in the United States and Canada increased 14%, from 4.180 million to 4.761 million. Ponds remain 9% below the long-term average, but after several dry years, more water on the breeding grounds is the kind of improvement duck hunters should welcome without asking it to show identification.
We will begin, as we usually do, with mallards. The 2026 mallard estimate is 5.859 million birds, down 11% from last year and 26% below the long-term average. The year-to-year decline is very concerning, but the long-term number deserves even more attention. This is the lowest mallard estimate in 33 years. When the most familiar and broadly distributed duck in the survey sits more than a quarter below its long-term average, it is difficult to dismiss the continued results.
Pintails offer even less room for creative optimism. Their estimate fell 11% to 1.988 milclion birds and is now 48% below the long-term average. Pintails remain one of the finest-looking ducks ever assembled by a higher power, but they continue to struggle with changes on the prairie, especially the loss and disturbance of nesting cover. The population keeps reminding us that a liberal bag limit and a healthy species are not necessarily the same thing. Check your local regulations, certainly, but remember that because you may legally shoot a duck does not mean you must shoot every one that presents the opportunity.
The teal numbers are not especially comforting either. Blue-winged teal declined 11% to 3.962 million and remain 22% below the long-term average. Green-winged teal fell 8% to 2.334 million, although they remain 6% above their long-term average.
Gadwalls slipped only 3% to 2.351 million and remain 13% above the long-term average. This is further proof that gadwalls can endure almost anything. Flood, drought, heat, cold – none of it seems to rattle them. They simply produce another generation of gray ducks capable of circling a decoy spread seven times, looking deeply interested, and then landing next door. I have called gadwalls the Swiss Army knife of ducks and, less charitably, the cockroach of puddle ducks. God bless them, they have grit. They are survivors.
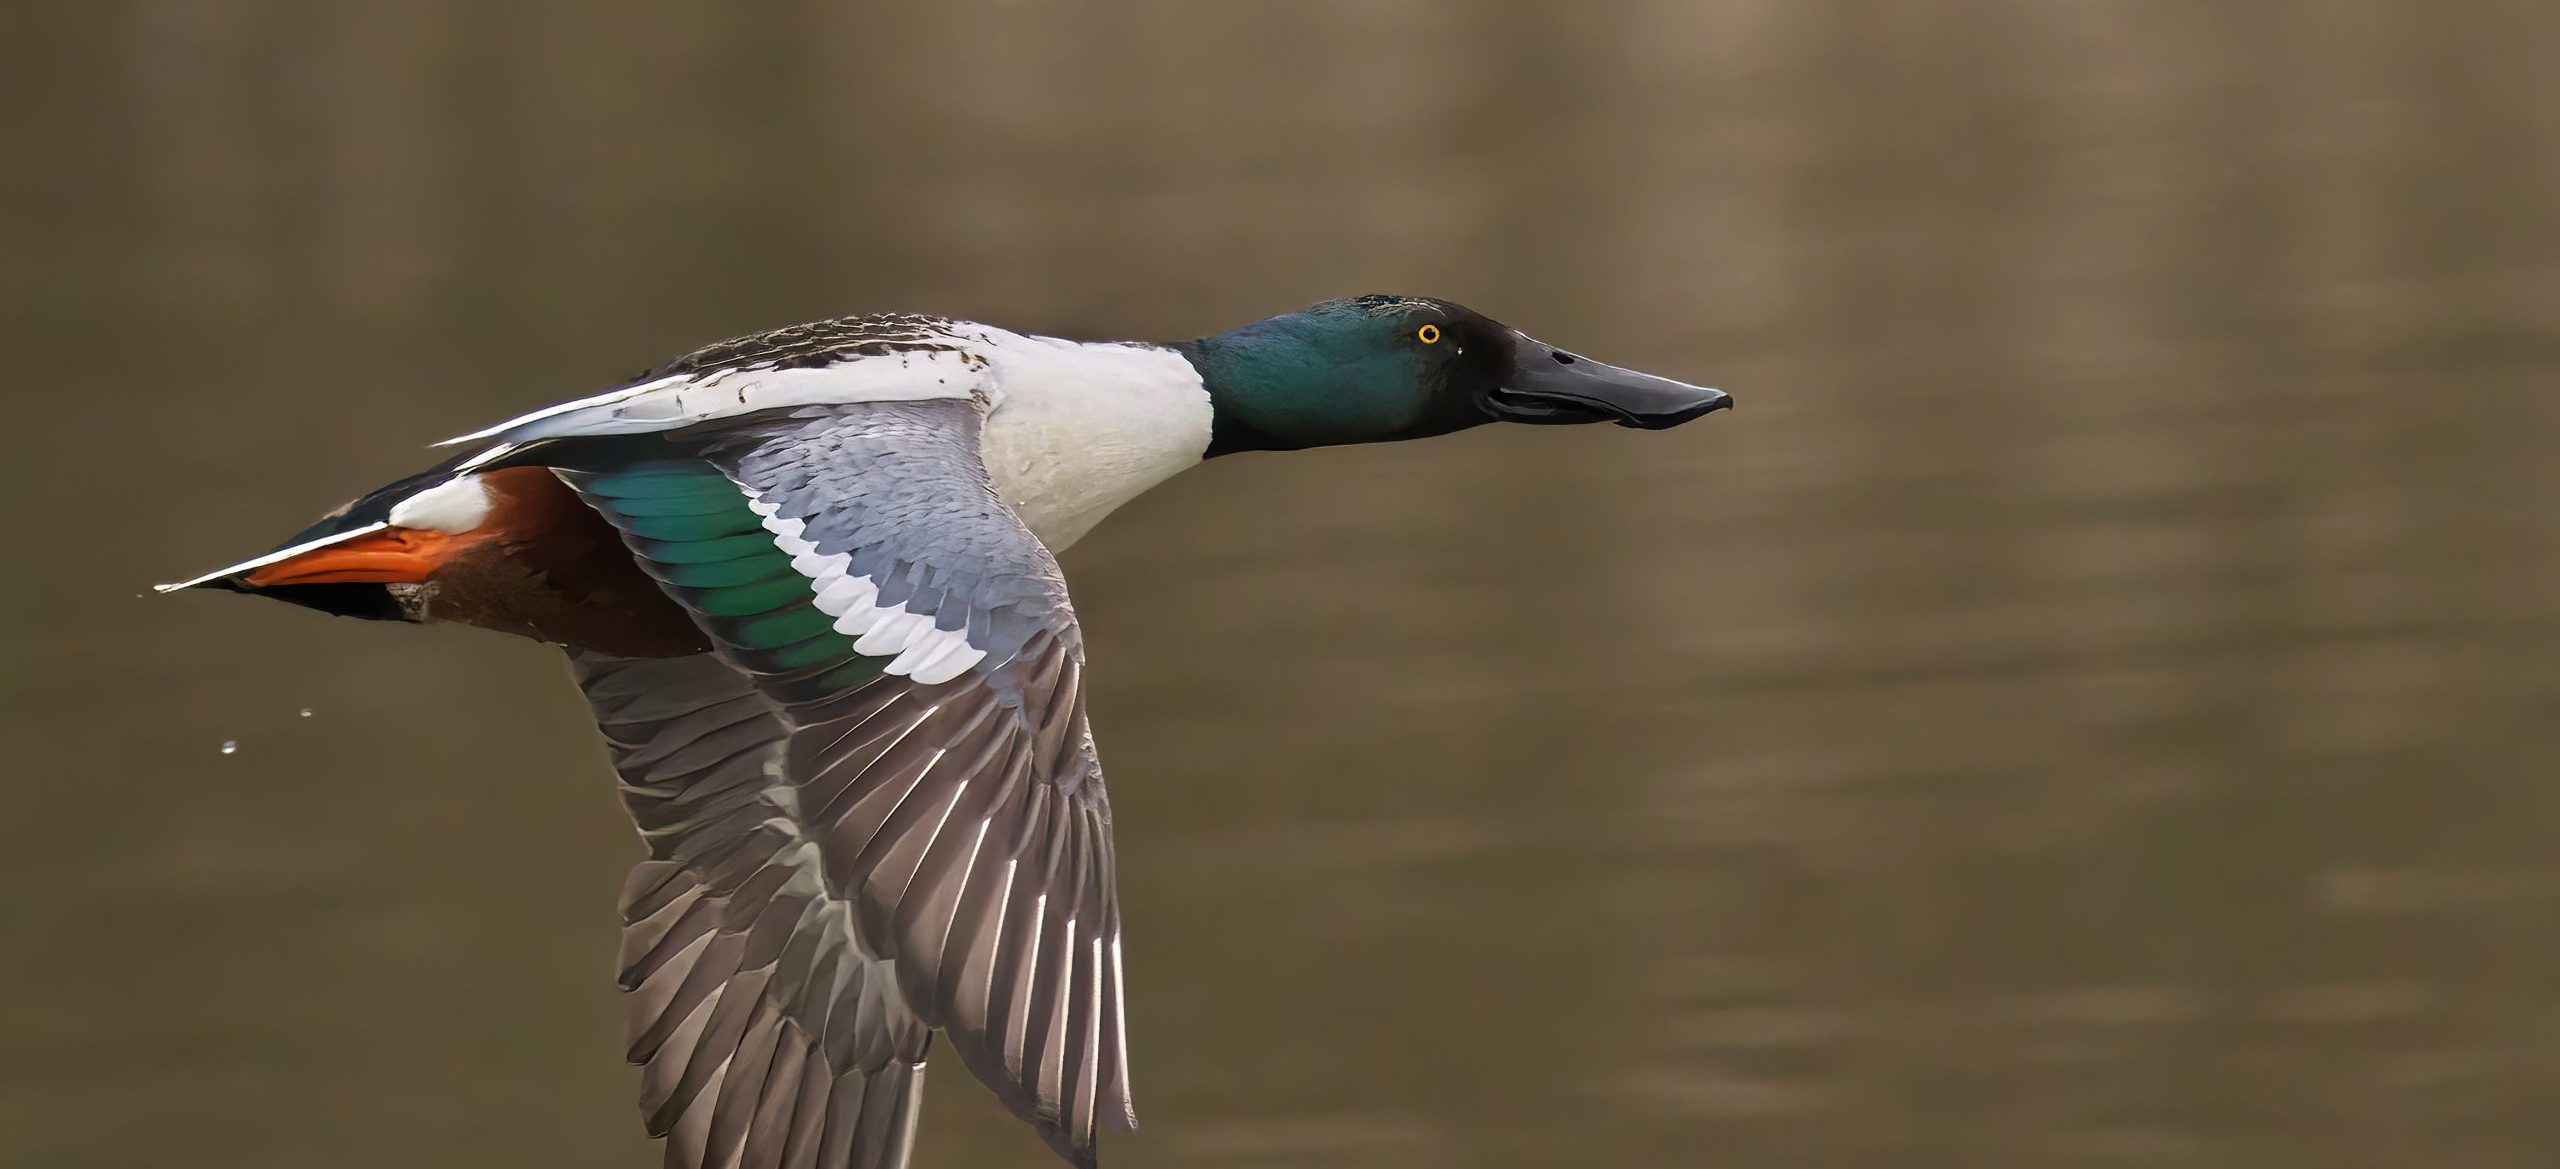
American wigeon declined 8% to 2.940 million but remain 12% above the long-term average. Northern shovelers, meanwhile, climbed 19% to 3.289 million and now stand 24% above the long-term average. Shovelers rarely receive the admiration they deserve, perhaps because hunters dislike admitting that they enjoy shooting them. They are the moped of ducks. Whatever. There should be more spoonbills available this fall, and this makes dogs happy.
The brightest portion of the report belongs mostly to diving ducks. Redheads increased 1% to 931,000 and are 26% above their long-term average. Canvasbacks rose 13% to 782,000, an impressive 32% above the long-term average. Scaup also increased 13% to 4.155 million, although bluebills remain 15% below their long-term average. That scaup number is a good example of why both columns matter. A strong improvement over last year is welcome, but it does not erase a longer decline. It is possible to be heading in the right direction and still have distance to travel.
Back to the ponds, because that may be the most consequential number in this year’s report. Ducks need water and the nesting cover and wetland complexes that surround it. More ponds can improve nesting opportunity, support broods, and give hens a better chance to renest. Ponds do not instantly turn into ducks; they create opportunity. What happens next depends on where the water fell, how long it remained there, predator pressure, nesting cover, and other factors that refuse to fit neatly into a DU or Delta graphic.
What does all of this mean for you and me? Probably a mixed fall, and one in which geography and weather will matter more than the continental totals. There will be fewer breeding ducks on the landscape overall, and the mallard and pintail numbers should temper expectations. At the same time, improved water conditions may help production and could put more young birds into portions of the migration than the breeding estimate suggests. We will not know that from this survey. Duck hunters beneath a migration on a weather day may insist the report was too pessimistic, while hunters two counties away will be certain the biologists accidentally counted coots.
The practical answer is the same one ducks have been teaching us for generations: scout harder, be flexible, and hunt the conditions in front of you. A continental estimate cannot tell you whether the back corner of your marsh has water, whether the farmer planted corn beside your lease, or whether a cold front will arrive on Tuesday instead of Friday. When ducks are concentrated, hunting can be excellent even in a down year. When warm weather and pressure scatter or stall them, 33 million ducks can feel like about eleven, all of them sitting someplace you aren’t.
Finally, the 2026 survey is neither a funeral notice nor a permission slip for complacency. Total ducks are down slightly, several important puddle-duck species need help, and pintails remain in especially poor long-term shape. But more ponds offer a genuine reason for hope, and the increases in canvasbacks, redheads, scaup, and shovelers are notable. Also remember wood ducks are not counted, and they may also be an important part of many bags, especially early. Conservation has always been a long game measured in habitat, weather, and patience. Duck hunting is much the same. Enjoy the good days, learn from the slow ones, take care, and preserve the places that produce birds. As always, be safe and wear your life jacket when you are on the water.
2026 Breeding Ducks by species (in millions)
| Species | 2026 | 2025 | LTA |
|---|---|---|---|
| Mallard | 5.859 | 6.554 | 7.94 |
| Gadwall | 2.351 | 2.414 | 2.05 |
| Wigeon | 2.940 | 3.191 | 2.63 |
| GWT | 2.334 | 2.550 | 2.18 |
| BWT | 3.962 | 4.432 | 5.11 |
| Shoveler | 3.289 | 2.758 | 2.64 |
| Pintail | 1.988 | 2.239 | 3.90 |
| Redhead | 0.931 | 0.918 | 0.73 |
| Canvasback | 0.782 | 0.690 | 0.59 |
| Scaup | 4.155 | 3.675 | 4.97 |
| Total | 33.44 | 33.98 |